Scoring and risk assessment

Measuring road risk with driving scores

We use the fundamental laws of physics combined with data science to measure road risk. 

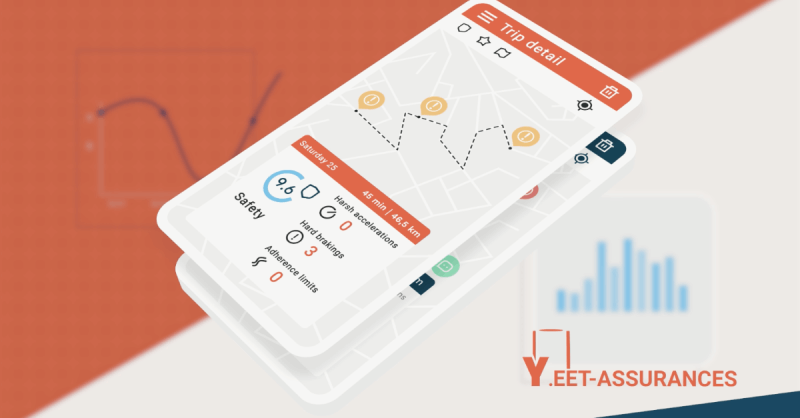
Illustration of the scores measuring driving

Clear and fair indicators

Safety

Safety

We measure safe driving with a simple and universal approach that considers vehicle dynamics, vehicle characteristics and contextual driving conditions.


Our platform identifies driving events that reflect a policyholder's driving styles including hard brakings and harsh accelerations with several levels of severity. It also assesses road adherence that is the adherence coefficient between the tire and the road.

Distracted driving

Phone distraction

Using a smartphone while driving significantly impairs the driver's focus on the road and extends their reaction time.

Our distraction score precisely measures the driver's use of smartphone. The DriveKit SDK identifies phone manipulations, phone calls, and the utilization of the audio system during a call.

Eco-driving

Eco-driving

We have developed a measure of driving efficiency in order to help drivers reduce their fuel consumption without increasing the trip duration.


Our approach compares the measured driving speed with an optimal speed profile. The eco-driving score represents the difference between the energy consumed and the minimum energy achievable for each trip.

Reduce phone distraction by up to 30%

Useful to drivers

Driver profile

Coaching

Driver coaching

Road accident detection

Crash detection

Transportation mode recognition

All-in-one mobility solution

Illustration of the indicators of the customizable offer and coaching DriveQuant

Driving scores for Pay-How-You-Drive programs

  • Driving habits
  • Performance statistics
  • Improvement history
  • Risk evaluation

Our platform provides three reliable driving scores for each trip: safety, phone distraction and eco-driving.


It also performs statistical processing and maintains a history of driving scores to identify with high accuracy the policyholder's driving profile.


All these driving indicators are critical for Pay-How-You-Drive programs.

A fun and pedagogical approach to make drivers safer on the road

  • Ranking
  • Challenge
  • Driving tips
  • Individual reports

Driving scores delivered by our SDK are shared with drivers after each trip for road safety purposes. For at-risk drivers, our SDK offers in-app coaching based on their driving profile and driving style. 


Insurers can use our telematics platform to organize road safety initiatives to reduce distracted driving or to promote eco-driving practices to their policyholders.

Protect drivers with a life-saving feature

  • 100% smartphone
  • Compatible with beacons
  • Accelerate claims management
  • Driver assistance

In addition to our driver behavior analysis, the DriveKit SDK offers crash detection. The service relies on the phone's sensors to identify collisions.


When a driver is involved in a car accident, an alert is sent to the insurer's platform. The insurer can take the right decision based on the crash data and send emergency services or roadside assistance depending on the severity of the crash. 

Measure all forms of mobility with smartphones

  • Alternative mobility
  • Public transport
  • Driver identification
  • CO2 compensation

Our platform has been trained to detect when policyholders are driving their car or using other modes of transportation such as bike, train or bus. This identification is performed based on data collected by the smartphone's sensors.

How are insurers using our driving scores to insure high-risk drivers?

Video cover

Didactic and accurate driving scores

The movement of a vehicle is governed by the laws of fundamental physics.


For analyzing driving behavior, we take into account crucial variables that describe the vehicle's motion, employing physical models in the process.


We have designed clear and fair driving scores and driving indicators in order to educate drivers and to promote a sustainable driving style.

Illustration of the explainable driving scores DriveQuant

The advantages of our driving scores

Reliable

Reliable

Our platform analyses the signals recorded by the smartphone's sensors. It corrects them if necessary in order to build reliable and simple indicators that can be correlated with road risk. It processes data from several thousand smartphone models spread over the 5 continents.

Explainable

Explainable

Our driving scores are based on scientific and physical models. We use fundamental relationships that explain the link between driving style observed by speed measurement and road risk or fuel consumption. This is a transparent approach that simplifies the exploitation of our data.

Contextualized

Contextualized

We consider contextual trip conditions, including weather and road type, as parameters that the driver cannot control but are utilized to contextualize their scores. Our models also factor in vehicle characteristics.

Rich

Rich

Our behaviour analysis is the most advanced solution on the market. The DriveKit SDK captures all types of driving events: harsh brakings, hard speedings, fuel consumption and distracted driving. Our driving analysis is performed based on more than 200 driving indicators collected for each trip. 

Simple access to data

Simple

We provide insurers documented application programming interfaces (APIs) to access data from their drivers or driver groups. It is possible to access raw data, driving indicators as well as statistical and historical aggregations of driving data.

Flexibles

Flexible

DriveQuant's driving scores and contextual indicators are extensive and specific. We help insurance companies incorporate these scores into their underwriting models to launch connected car insuranceprograms. 

Make an informed decision

How many driving scores do you provide?

Our driving behavior analysis platform provides three driving scores as standard: a safety score, a distraction score and an eco-driving score. Optionally, we provide a fourth score linked to speed limits.

How do you measure the safety score?

The safety score is based on harsh accelerations, hard brakings and the vehicle's limits of adherence.

How do you measure the distraction score?

Based on sensors in smartphones, we detect manipulations of the phone and calls received or made when the vehicle is in motion. The distraction score is calculated based on the number of distraction events detected and their duration.

How do you measure the eco-driving score?

The eco-driving score represents the energy efficiency ratio between (1) the energy consumed to cover a distance measured by the phone's sensors (calculated physically) and (2) the energy required to complete the same journey with an energy-optimized speed profile, maintaining iso-distance and iso-time.
For instance, achieving a score of 8/10 indicates that it would have been feasible to conserve 20% of energy by simply adjusting your driving habits, such as avoiding abrupt accelerations, anticipating braking, and maintaining a consistent speed whenever possible.

How to follow the evolution of the driving scores of your customers/users?

We provide you with a dashboard in which you will find all your user's driving data including their driving scores, their rankings, and optionally their trips. To find out more about the functionalities of our dashboard, consult the dedicated page.
It is also possible to get the data directly on your backend via API or automated push system.

What driving data is visible to my customers/users in the app?

The application limits the services visible to end users based on the services you subscribed to. Users can view enabled scores as set up within the app. Additionally, to increase user engagement, we provide a weekly, monthly, and annual comprehensive summary of their driving performance. Detailed information about each trip, including fuel consumption, CO2 emissions, mileage tracking, and their position within the community ranking, is also accessible.